SPM 2019 Add Maths Paper 2, Question 11Linear Law
Solved on video in English and Bahasa Melayu · 10 marks · Form 4, Linear Law · 5:50 video
The question
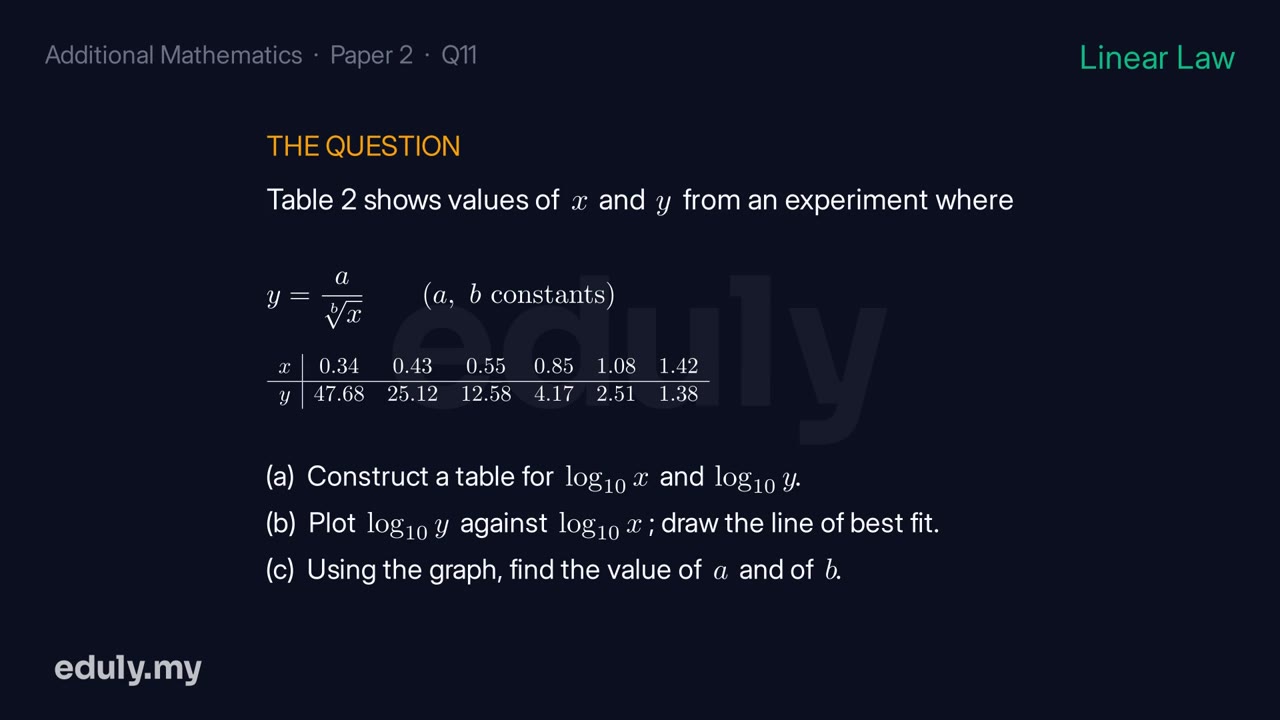
Use the graph paper provided to answer this question. Table 2 shows the values of two variables, x and y, obtained from an experiment. The variables x and y are related by the equation y = a/(b*sqrt(x)), where a and b are constants. Table 2: x = 0.34, 0.43, 0.55, 0.85, 1.08, 1.42 with corresponding y = 47.68, 25.12, 12.58, 4.17, 2.51, 1.38. (a) Based on Table 2, construct a table for the values of log10(x) and log10(y). (b) Plot log10(y) against log10(x), using a scale of 2 cm to 0.1 unit on the X-axis and 2 cm to 0.2 unit on the Y-axis. Hence, draw the line of best fit. (c) Using the graph in 11(b), find the value of (i) a, (ii) b.
[10 marks]
 5:50
5:50Step 1
Compute log10(x): -0.47, -0.37, -0.26, -0.07, 0.03, 0.15 (for x=0.34,...,1.42). Compute log10(y): 1.68, 1.40, 1.10, 0.62, 0.40, 0.14 (for y=47.68,...,1.38).
6 more steps, each with the reason for it, in the full solution
Final answer
Table and graph (see video); a ≈ 3.0, b ≈ 0.40
Where students lose marks
Watch out: don't measure rise and run in cm. Use each axis's own scale (2 cm = 0.1 on X, 0.2 on Y).
Watch every step of this question solved on video (5:50), with the reason behind each step and a box that checks your own answer.
No card. Every past-year question on video, in English and BM.
More Linear Law questions
- Kuala Lumpur Trial 2025 Add Maths Paper 1, Question 7
- Kuala Lumpur Trial 2025 Add Maths Paper 2, Question 10
- Melaka Trial 2025 Add Maths Paper 1, Question 7
- Melaka Trial 2025 Add Maths Paper 2, Question 11
- MRSM Trial 2025 Add Maths Paper 1, Question 3
- MRSM Trial 2025 Add Maths Paper 2, Question 11
- Selangor Trial 2025 Add Maths Paper 1, Question 2
- Selangor Trial 2025 Add Maths Paper 2, Question 10
Questions are re-typeset by Eduly for study and commentary. Eduly is not affiliated with Lembaga Peperiksaan Malaysia or the Ministry of Education.