SPM 2019 Add Maths Paper 1, Question 25Probability Distribution
Solved on video in English and Bahasa Melayu · 4 marks · Form 5, Probability Distribution · 6:07 video
The question
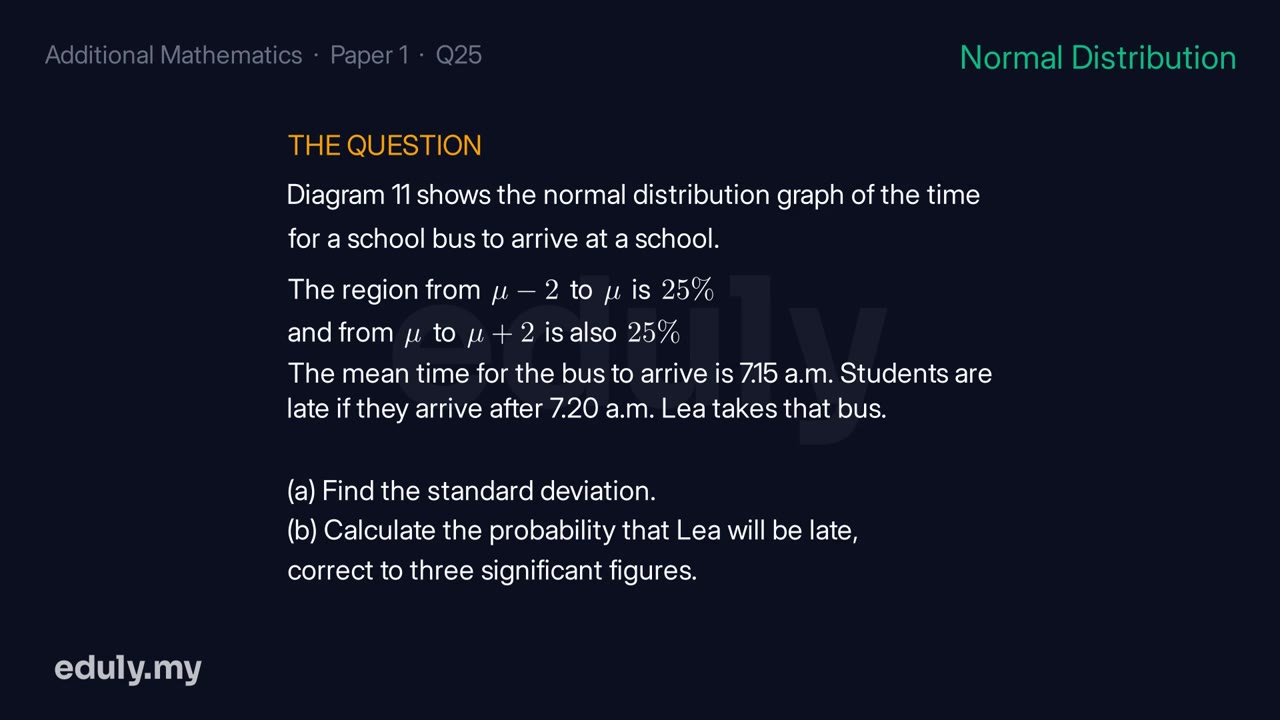
Diagram 11 shows the normal distribution graph of the time for a school bus to arrive at a school. The area between 2 minutes below the mean and the mean is 25%, and the area between the mean and 2 minutes above the mean is 25% (so together they cover 50%), while the two outer tails beyond mean-2 minutes and beyond mean+2 minutes each cover the remaining 25%. (a) Find the standard deviation. (b) It is given that the mean time for the bus to arrive at the school is 7.15 a.m. Students are considered late if they arrive after 7.20 a.m. Lea takes that bus to school. Calculate the probability that Lea will be late. Give your answer correct to three significant figures.
[4 marks]
 6:07
6:07Step 1
The area to the right of mu+2 is 25% = 0.25, so P(X > mu+2) = 0.25, i.e. P(Z > 2/sigma) = 0.25.
Why this step
The diagram splits the area into four equal parts, so the tail beyond μ + 2 is 25%. Standardising cancels μ, leaving 2/σ.
5 more steps, each with the reason for it, in the full solution
Final answer
(a) σ = 2.9674 minutes; (b) P(late) = 0.0460
Where students lose marks
Watch out: match the 25% tail to the right z-value, and convert the clock times into a 5-minute gap.
Watch every step of this question solved on video (6:07), with the reason behind each step and a box that checks your own answer.
No card. Every past-year question on video, in English and BM.
More Probability Distribution questions
- SPM 2023 Add Maths Paper 2, Question 9
- SPM 2024 Add Maths Paper 1, Question 12
- SPM 2024 Add Maths Paper 2, Question 6
- Kuala Lumpur Trial 2025 Add Maths Paper 2, Question 11
- Melaka Trial 2025 Add Maths Paper 1, Question 15
- MRSM Trial 2025 Add Maths Paper 1, Question 12
- MRSM Trial 2025 Add Maths Paper 2, Question 9
- Selangor Trial 2025 Add Maths Paper 2, Question 11
Questions are re-typeset by Eduly for study and commentary. Eduly is not affiliated with Lembaga Peperiksaan Malaysia or the Ministry of Education.