SPM 2017 Add Maths Paper 1, Question 24Probability Distribution
Solved on video in English and Bahasa Melayu · 3 marks · Form 5, Probability Distribution · 5:46 video
The question
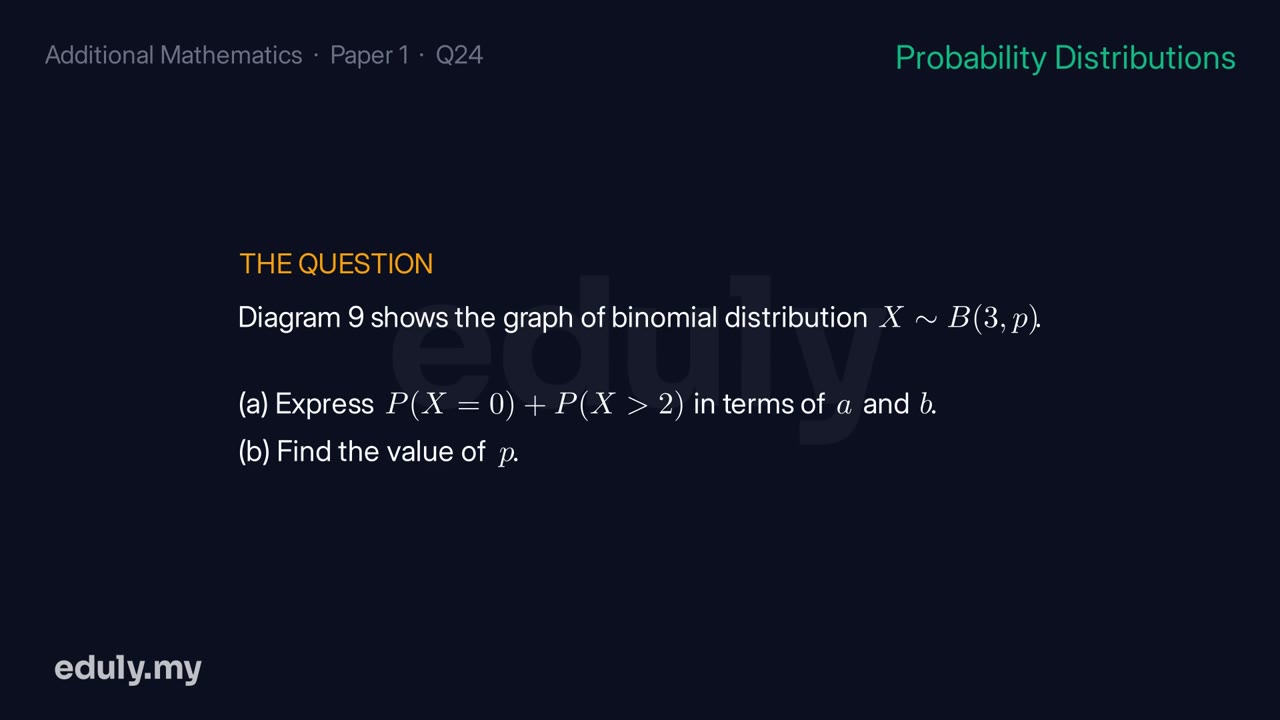
Diagram 9 shows the graph of binomial distribution X ~ B(3, p). (a) Express P(X=0) + P(X>2) in terms of a and b. (b) Find the value of p.
[3 marks]
 5:46
5:46Step 1
Since X can only take values 0,1,2,3, the probabilities sum to 1: P(X=0)+P(X=1)+P(X=2)+P(X=3) = 1, i.e. P(X=0) + a + b + P(X=3) = 1.
Why this step
The bars cover every possible outcome, so their heights must add to 1. That's how we bring a and b into the equation.
4 more steps, each with the reason for it, in the full solution
Final answer
(a) 1 − a − b; (b) p = 4/7
Where students lose marks
Watch out: X can't exceed 3, so P(X>2) = P(X=3). In (b), the cube root gives 1 − p, so subtract from 1.
Watch every step of this question solved on video (5:46), with the reason behind each step and a box that checks your own answer.
No card. Every past-year question on video, in English and BM.
More Probability Distribution questions
- SPM 2023 Add Maths Paper 2, Question 9
- SPM 2024 Add Maths Paper 1, Question 12
- SPM 2024 Add Maths Paper 2, Question 6
- Kuala Lumpur Trial 2025 Add Maths Paper 2, Question 11
- Melaka Trial 2025 Add Maths Paper 1, Question 15
- MRSM Trial 2025 Add Maths Paper 1, Question 12
- MRSM Trial 2025 Add Maths Paper 2, Question 9
- Selangor Trial 2025 Add Maths Paper 2, Question 11
Questions are re-typeset by Eduly for study and commentary. Eduly is not affiliated with Lembaga Peperiksaan Malaysia or the Ministry of Education.